Here are the Top 10 Worst Places to get a Global Entry Interview in 2024.
We rank the best and worst locations in this blog post. Here, we present the data and methodology for this ranking.
The availability of each location is checked periodically (currently every minute or so, every 15 minutes in the past) and, if the soonest appointment date has changed, we record the new nearest appointment. We call this an “update”.
Analyzing the past data for each location, we can determine within a given time frame how often appointments were available. We define an appointment as available if the nearest date is within a certain number of days of the time at which the update was made (max days out).
The main metric we use to rank locations is the fraction of time within a given time frame in which an appointment was available. This fraction is shown as a percentage in the tables below, which show different time frames (from January 1st to June 5th or March 1st to June 5th) as well as different max days out (30 and 90).
We then rank locations based on this fraction of time they had an available appointment: 0% being no appointments were available during this time frame and 100% being appointments were always available.
Some locations only operate periodically or were not operating during a large chunk of our time frame. To filter these locations out, we use the number of updates as a proxy for the location’s activity. To make a final list of the best or worst locations, we can define a minimum number of updates for a location to be considered active and discard locations with too few updates. This threshold number of updates will depend on the length of the time frame: longer time frames will have a higher threshold number of updates.
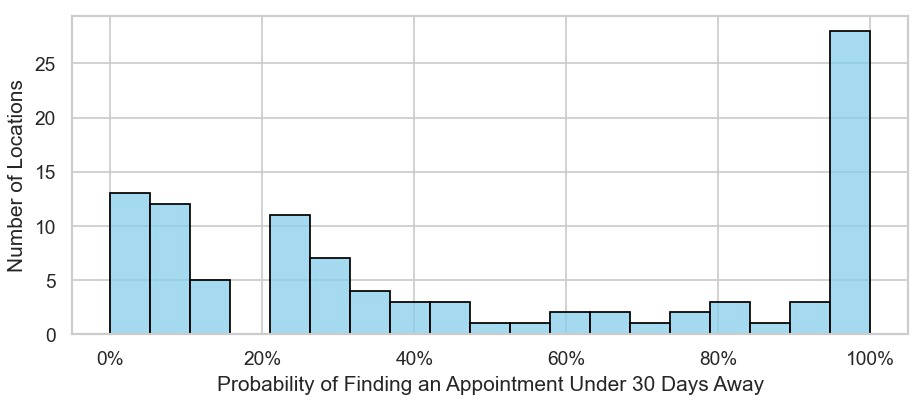
The plot at the top of the page shows the distribution of location probabilities of finding an appointment under 30 days away since January and filtering any locations with fewer than 190 updates. Below are the tables listing the locations, probabilities, and number of updates.
The table below shows the probability of an appointment being available within 30 days since January 1, 2024.
| Location | Average Probability | Number of Updates |
|---|---|---|
| SEAFO - Missoula International Airport | 0.00% | 1 |
| Richmond, VA Enrollment Center | 0.38% | 101 |
| Omaha, NE Enrollment Center | 1.05% | 200 |
| New Jersey Metro Area Mobile EC | 1.29% | 106 |
| Portland, OR Enrollment Center | 2.13% | 1989 |
| Salt Lake City International Airport | 2.17% | 3757 |
| San Diego International Airport EC | 2.22% | 947 |
| Charlotte-Douglas International Airport | 2.23% | 668 |
| Fort Lauderdale International Airport (Terminal 1) | 2.55% | 63 |
| Moline-Quad Cities International Airport | 2.79% | 513 |
| Bradley International Airport Enrollment Center | 3.25% | 2514 |
| Nashville Enrollment Center | 3.28% | 1346 |
| Austin-Bergstrom International Airport | 3.81% | 1032 |
| Chicago Mobile Event | 4.13% | 211 |
| Des Moines GE Enrollment Center | 4.59% | 400 |
| South Bend Enrollment Center | 4.66% | 366 |
| Milwaukee Enrollment Center | 4.81% | 1619 |
| Rockford-Chicago International Airport | 6.05% | 591 |
| Peoria international airport | 6.24% | 388 |
| Cleveland U.S. Customs and border protection | 6.58% | 2579 |
| San Francisco Global Entry Enrollment Center | 6.72% | 7375 |
| Otay Mesa Enrollment Center | 7.30% | 8381 |
| Atlantic City Airport Global Entry Mobile Event | 7.39% | 178 |
| Huntsville Global Entry Enrollment Center | 8.52% | 2527 |
| Treasure Coast International Airport | 8.90% | 1627 |
| Boise Enrollment Center | 9.43% | 718 |
| Springfield - Branson National Airport, MO | 9.55% | 757 |
| Shreveport Regional Airport | 9.56% | 88 |
| St. Louis Enrollment Center | 10.00% | 1115 |
| Philadelphia International Airport | 10.02% | 4444 |
| Dayton Enrollment Center | 10.02% | 2716 |
| Washington Dulles International Global Entry EC | 13.02% | 3316 |
| Kansas City Enrollment Center | 13.94% | 1505 |
| Orlando International Airport | 14.36% | 4790 |
| Dallas-Fort Worth International Airport Global Entry | 14.56% | 4389 |
| Tri-cities Enrollment Center | 15.09% | 301 |
| Tampa Enrollment Center | 21.32% | 4839 |
| Cincinnati Enrollment Center | 21.42% | 2373 |
| Honolulu Enrollment Center | 21.68% | 2719 |
| Calexico Enrollment Center | 21.95% | 2472 |
| West Palm Beach Enrollment Center | 22.54% | 3358 |
| Phoenix Sky Harbor Global Entry Enrollment Center | 23.33% | 5185 |
| Boston-Logan Global Entry Enrollment Center | 24.07% | 3353 |
| Pittsburgh International Airport | 24.23% | 2925 |
| Sanford Global Entry Enrollment Center | 25.31% | 4779 |
| Mobile Regional Airport Enrollment Center | 26.20% | 1804 |
| Houston Intercontinental Global Entry EC | 26.28% | 1699 |
| Special Event-Ontario Intl Airport(California)2024 | 26.43% | 28 |
| SEAFO - Bozeman Airport | 26.87% | 263 |
| Denver International Airport | 28.18% | 4016 |
| Tucson Enrollment Center | 28.60% | 3176 |
| Atlanta International Global Entry EC | 28.72% | 3317 |
| U.S. Custom House - Bowling Green | 29.67% | 7713 |
| Minneapolis - St. Paul Global Entry EC | 30.26% | 2604 |
| BAL-FO Harrisburg Enrollment Center | 30.61% | 860 |
| New Orleans Enrollment Center | 32.45% | 2434 |
| Baltimore Washington Thurgood Marshall Airport | 33.56% | 3834 |
| Las Vegas Enrollment Center | 34.67% | 2800 |
| Ontario Intl Airport GE (California) | 35.84% | 1964 |
| BAL-FO Wilmington Delaware Enrollment Center | 37.02% | 1372 |
| San Luis Enrollment Center | 38.65% | 3217 |
| Washington, DC Enrollment Center | 39.72% | 3720 |
| Port Clinton, Ohio Enrollment Center | 42.25% | 1841 |
| San Antonio International Airport | 42.77% | 3019 |
| Seatac International Airport Global Entry EC | 47.30% | 4946 |
| CFO - Louisville Intl Airport 2024 | 47.68% | 151 |
| Norfolk EC | 48.69% | 2692 |
| Niagara Falls Enrollment Center | 53.85% | 4057 |
| Chicago O'Hare International Global Entry EC | 60.15% | 6123 |
| Los Angeles International Global Entry EC | 61.36% | 6888 |
| Champlain Global Entry | 63.78% | 743 |
| Blue Grass Airport 2024 | 65.44% | 102 |
| Fort Lauderdale Global Entry Enrollment Center | 68.41% | 3019 |
| Chicago Field Office Enrollment Center | 70.26% | 4233 |
| Sweetgrass NEXUS and FAST Enrollment Center | 75.88% | 1515 |
| Fargo Satellite Enrollment Center | 76.13% | 411 |
| Blaine Global Entry Enrollment Center | 81.45% | 1607 |
| Gulfport-Biloxi Global Entry Enrollment Center | 81.95% | 1417 |
| Newark Liberty Intl Airport | 82.10% | 8411 |
| Port Huron Enrollment Center | 88.73% | 1686 |
| Pembina Global Entry Enrollment Center | 91.02% | 633 |
| PortMiami | 93.89% | 2291 |
| Niagara Falls Enrollment Center GE Only | 94.27% | 246 |
| Sweetgrass Global Entry Enrollment Center | 96.29% | 658 |
| Miami International Airport | 96.48% | 5203 |
| JFK International Global Entry EC | 96.57% | 7425 |
| Champlain NEXUS and FAST | 97.51% | 1791 |
| Houlton POE/Woodstock | 97.61% | 1073 |
| Memphis Intl Airport Global Enrollment Center | 97.71% | 2528 |
| Grand Portage | 97.96% | 5237 |
| Laredo Enrollment Center | 97.98% | 2961 |
| Ogdensburg Enrollment Center | 98.00% | 1095 |
| Albany GE Event Enrollment | 98.10% | 18 |
| Warroad Enrollment Center | 98.10% | 1848 |
| International Falls Global Entry Enrollment Center | 98.21% | 650 |
| Lansdowne (Thousand Islands Bridge) - GE ONLY | 98.49% | 106 |
| Brownsville Enrollment Center | 98.69% | 1287 |
| Hidalgo Enrollment Center | 98.78% | 1787 |
| Detroit Metro Airport | 98.85% | 1927 |
| San Juan Global Entry Enrollment Center | 98.86% | 4940 |
| Nogales, AZ | 98.87% | 1789 |
| Fairbanks Enrollment Center | 98.88% | 2169 |
| El Paso Enrollment Center | 98.94% | 2078 |
| Detroit Enrollment Center Global Entry | 98.94% | 2684 |
| Sault Ste Marie Enrollment Center | 98.98% | 1596 |
| Calais Enrollment Center | 98.99% | 1978 |
| Guam International Airport | 99.02% | 2477 |
| Albuquerque Enrollment Center | 99.05% | 1766 |
| Derby Line Enrollment Center | 99.06% | 1516 |
| Anchorage Enrollment Center | 99.09% | 1223 |
| Douglas Enrollment Center | 99.12% | 1880 |
| Eagle Pass | 99.15% | 1345 |
| Del Rio Enrollment Center | 99.19% | 930 |
| ERIE-Tom Ridge Field 2024 | 100.00% | 24 |
The table below shows the probability of an appointment being available within 90 days since January 1, 2024.
| Location | Average Probability | Number of Updates |
|---|---|---|
| SEAFO - Missoula International Airport | 0.00% | 1 |
| Richmond, VA Enrollment Center | 0.40% | 101 |
| Omaha, NE Enrollment Center | 1.49% | 200 |
| Fort Lauderdale International Airport (Terminal 1) | 2.55% | 63 |
| Charlotte-Douglas International Airport | 2.77% | 668 |
| San Diego International Airport EC | 4.10% | 947 |
| Chicago Mobile Event | 5.36% | 211 |
| Des Moines GE Enrollment Center | 5.42% | 400 |
| Portland, OR Enrollment Center | 5.54% | 1989 |
| Nashville Enrollment Center | 5.85% | 1346 |
| Atlantic City Airport Global Entry Mobile Event | 7.60% | 178 |
| Otay Mesa Enrollment Center | 8.15% | 8381 |
| Salt Lake City International Airport | 8.26% | 3757 |
| South Bend Enrollment Center | 8.67% | 366 |
| Bradley International Airport Enrollment Center | 10.97% | 2514 |
| St. Louis Enrollment Center | 12.26% | 1115 |
| Boise Enrollment Center | 12.38% | 718 |
| Austin-Bergstrom International Airport | 12.85% | 1032 |
| Huntsville Global Entry Enrollment Center | 13.35% | 2527 |
| Tri-cities Enrollment Center | 15.46% | 301 |
| Dayton Enrollment Center | 15.95% | 2716 |
| Springfield - Branson National Airport, MO | 16.46% | 757 |
| Peoria international airport | 16.79% | 388 |
| Kansas City Enrollment Center | 16.79% | 1505 |
| Rockford-Chicago International Airport | 18.13% | 591 |
| Cleveland U.S. Customs and border protection | 18.35% | 2579 |
| Moline-Quad Cities International Airport | 18.53% | 513 |
| Milwaukee Enrollment Center | 22.09% | 1619 |
| San Francisco Global Entry Enrollment Center | 22.63% | 7375 |
| Cincinnati Enrollment Center | 22.83% | 2373 |
| Special Event-Ontario Intl Airport(California)2024 | 26.43% | 28 |
| SEAFO - Bozeman Airport | 26.87% | 263 |
| Calexico Enrollment Center | 27.29% | 2472 |
| Houston Intercontinental Global Entry EC | 28.72% | 1699 |
| Atlanta International Global Entry EC | 29.95% | 3317 |
| BAL-FO Harrisburg Enrollment Center | 31.36% | 860 |
| BAL-FO Wilmington Delaware Enrollment Center | 37.02% | 1372 |
| Ontario Intl Airport GE (California) | 38.58% | 1964 |
| Washington Dulles International Global Entry EC | 40.52% | 3316 |
| Denver International Airport | 40.63% | 4016 |
| Boston-Logan Global Entry Enrollment Center | 41.13% | 3353 |
| CFO - Louisville Intl Airport 2024 | 47.68% | 151 |
| San Antonio International Airport | 48.20% | 3019 |
| Tampa Enrollment Center | 51.83% | 4839 |
| Dallas-Fort Worth International Airport Global Entry | 52.00% | 4389 |
| Port Clinton, Ohio Enrollment Center | 52.23% | 1841 |
| Baltimore Washington Thurgood Marshall Airport | 52.57% | 3834 |
| Las Vegas Enrollment Center | 52.72% | 2800 |
| Seatac International Airport Global Entry EC | 55.57% | 4946 |
| Minneapolis - St. Paul Global Entry EC | 55.69% | 2604 |
| Philadelphia International Airport | 56.52% | 4444 |
| Orlando International Airport | 59.18% | 4790 |
| Norfolk EC | 60.61% | 2692 |
| Washington, DC Enrollment Center | 62.68% | 3720 |
| Blue Grass Airport 2024 | 65.44% | 102 |
| Los Angeles International Global Entry EC | 70.05% | 6888 |
| Chicago O'Hare International Global Entry EC | 70.91% | 6123 |
| Honolulu Enrollment Center | 71.40% | 2719 |
| Chicago Field Office Enrollment Center | 72.83% | 4233 |
| Fargo Satellite Enrollment Center | 76.16% | 411 |
| New Jersey Metro Area Mobile EC | 77.39% | 106 |
| Fort Lauderdale Global Entry Enrollment Center | 77.70% | 3019 |
| Shreveport Regional Airport | 78.41% | 88 |
| Treasure Coast International Airport | 81.78% | 1627 |
| Sanford Global Entry Enrollment Center | 84.11% | 4779 |
| San Luis Enrollment Center | 84.17% | 3217 |
| New Orleans Enrollment Center | 84.69% | 2434 |
| Champlain Global Entry | 85.58% | 743 |
| Pittsburgh International Airport | 87.31% | 2925 |
| Sweetgrass NEXUS and FAST Enrollment Center | 90.45% | 1515 |
| Gulfport-Biloxi Global Entry Enrollment Center | 91.05% | 1417 |
| Mobile Regional Airport Enrollment Center | 93.80% | 1804 |
| Pembina Global Entry Enrollment Center | 94.64% | 633 |
| Phoenix Sky Harbor Global Entry Enrollment Center | 95.78% | 5185 |
| U.S. Custom House - Bowling Green | 95.97% | 7713 |
| Sweetgrass Global Entry Enrollment Center | 96.29% | 658 |
| Miami International Airport | 96.48% | 5203 |
| PortMiami | 96.79% | 2291 |
| JFK International Global Entry EC | 96.88% | 7425 |
| Blaine Global Entry Enrollment Center | 97.28% | 1607 |
| Newark Liberty Intl Airport | 97.54% | 8411 |
| Houlton POE/Woodstock | 97.61% | 1073 |
| Memphis Intl Airport Global Enrollment Center | 97.71% | 2528 |
| Grand Portage | 97.96% | 5237 |
| Laredo Enrollment Center | 97.98% | 2961 |
| Albany GE Event Enrollment | 98.10% | 18 |
| Warroad Enrollment Center | 98.10% | 1848 |
| International Falls Global Entry Enrollment Center | 98.21% | 650 |
| West Palm Beach Enrollment Center | 98.47% | 3358 |
| Lansdowne (Thousand Islands Bridge) - GE ONLY | 98.49% | 106 |
| Ogdensburg Enrollment Center | 98.53% | 1095 |
| Niagara Falls Enrollment Center | 98.77% | 4057 |
| Hidalgo Enrollment Center | 98.78% | 1787 |
| Tucson Enrollment Center | 98.84% | 3176 |
| Detroit Metro Airport | 98.85% | 1927 |
| San Juan Global Entry Enrollment Center | 98.86% | 4940 |
| Nogales, AZ | 98.87% | 1789 |
| Fairbanks Enrollment Center | 98.88% | 2169 |
| Champlain NEXUS and FAST | 98.91% | 1791 |
| El Paso Enrollment Center | 98.94% | 2078 |
| Detroit Enrollment Center Global Entry | 98.94% | 2684 |
| Sault Ste Marie Enrollment Center | 98.98% | 1596 |
| Port Huron Enrollment Center | 98.99% | 1686 |
| Calais Enrollment Center | 98.99% | 1978 |
| Guam International Airport | 99.02% | 2477 |
| Albuquerque Enrollment Center | 99.05% | 1766 |
| Derby Line Enrollment Center | 99.06% | 1516 |
| Anchorage Enrollment Center | 99.09% | 1223 |
| Brownsville Enrollment Center | 99.11% | 1287 |
| Douglas Enrollment Center | 99.12% | 1880 |
| Eagle Pass | 99.15% | 1345 |
| Del Rio Enrollment Center | 99.19% | 930 |
| Niagara Falls Enrollment Center GE Only | 99.90% | 246 |
| ERIE-Tom Ridge Field 2024 | 100.00% | 24 |
The table below shows the probability of an appointment being available within 30 days since March 1, 2024.
| Location | Average Probability | Number of Updates |
|---|---|---|
| SEAFO - Missoula International Airport | 0.00% | 0 |
| Richmond, VA Enrollment Center | 0.34% | 64 |
| Salt Lake City International Airport | 1.38% | 2004 |
| Portland, OR Enrollment Center | 1.48% | 916 |
| Omaha, NE Enrollment Center | 1.60% | 143 |
| New Jersey Metro Area Mobile EC | 2.11% | 106 |
| Charlotte-Douglas International Airport | 2.42% | 477 |
| San Diego International Airport EC | 2.55% | 670 |
| Milwaukee Enrollment Center | 3.05% | 510 |
| Nashville Enrollment Center | 3.41% | 852 |
| Rockford-Chicago International Airport | 3.67% | 292 |
| Austin-Bergstrom International Airport | 3.73% | 584 |
| Moline-Quad Cities International Airport | 3.75% | 282 |
| Bradley International Airport Enrollment Center | 4.39% | 1723 |
| Chicago Mobile Event | 4.96% | 144 |
| South Bend Enrollment Center | 6.09% | 261 |
| Otay Mesa Enrollment Center | 6.81% | 5468 |
| Des Moines GE Enrollment Center | 7.03% | 305 |
| Huntsville Global Entry Enrollment Center | 7.48% | 1524 |
| Atlantic City Airport Global Entry Mobile Event | 7.98% | 77 |
| San Francisco Global Entry Enrollment Center | 8.30% | 4952 |
| Cleveland U.S. Customs and border protection | 8.42% | 1190 |
| St. Louis Enrollment Center | 8.87% | 674 |
| Springfield - Branson National Airport, MO | 8.94% | 350 |
| Peoria international airport | 9.71% | 216 |
| Philadelphia International Airport | 11.06% | 2490 |
| Treasure Coast International Airport | 11.75% | 641 |
| Dayton Enrollment Center | 11.97% | 1377 |
| Boise Enrollment Center | 12.05% | 404 |
| Washington Dulles International Global Entry EC | 13.65% | 2170 |
| CFO - Louisville Intl Airport 2024 | 14.64% | 151 |
| Shreveport Regional Airport | 15.60% | 88 |
| Orlando International Airport | 15.87% | 2589 |
| Dallas-Fort Worth International Airport Global Entry | 18.65% | 2851 |
| Kansas City Enrollment Center | 18.78% | 858 |
| Tri-cities Enrollment Center | 20.51% | 203 |
| Denver International Airport | 24.16% | 2061 |
| Calexico Enrollment Center | 24.28% | 1630 |
| Pittsburgh International Airport | 26.06% | 1673 |
| West Palm Beach Enrollment Center | 27.10% | 1613 |
| Honolulu Enrollment Center | 28.33% | 1463 |
| Tucson Enrollment Center | 28.92% | 1581 |
| Cincinnati Enrollment Center | 29.22% | 1464 |
| Sanford Global Entry Enrollment Center | 29.58% | 2490 |
| Minneapolis - St. Paul Global Entry EC | 30.04% | 1655 |
| Mobile Regional Airport Enrollment Center | 31.17% | 914 |
| U.S. Custom House - Bowling Green | 31.20% | 4177 |
| SEAFO - Bozeman Airport | 31.55% | 127 |
| Tampa Enrollment Center | 31.91% | 2777 |
| Phoenix Sky Harbor Global Entry Enrollment Center | 32.60% | 2959 |
| Atlanta International Global Entry EC | 33.28% | 2170 |
| Port Clinton, Ohio Enrollment Center | 36.27% | 880 |
| Boston-Logan Global Entry Enrollment Center | 37.28% | 2630 |
| Las Vegas Enrollment Center | 38.33% | 1649 |
| Houston Intercontinental Global Entry EC | 38.60% | 1303 |
| San Luis Enrollment Center | 40.74% | 1633 |
| New Orleans Enrollment Center | 42.54% | 1343 |
| BAL-FO Harrisburg Enrollment Center | 42.93% | 516 |
| Baltimore Washington Thurgood Marshall Airport | 43.36% | 2597 |
| BAL-FO Wilmington Delaware Enrollment Center | 43.43% | 790 |
| Blue Grass Airport 2024 | 43.61% | 102 |
| Washington, DC Enrollment Center | 44.76% | 2159 |
| Norfolk EC | 45.66% | 1482 |
| Ontario Intl Airport GE (California) | 47.46% | 1498 |
| Niagara Falls Enrollment Center | 54.37% | 2096 |
| Chicago O'Hare International Global Entry EC | 55.16% | 3125 |
| San Antonio International Airport | 57.63% | 1884 |
| Seatac International Airport Global Entry EC | 57.93% | 2481 |
| Sweetgrass NEXUS and FAST Enrollment Center | 62.79% | 550 |
| Chicago Field Office Enrollment Center | 67.40% | 2418 |
| Los Angeles International Global Entry EC | 71.56% | 3687 |
| Fargo Satellite Enrollment Center | 72.01% | 264 |
| Champlain Global Entry | 82.58% | 254 |
| Port Huron Enrollment Center | 82.93% | 892 |
| Fort Lauderdale Global Entry Enrollment Center | 88.22% | 1746 |
| Niagara Falls Enrollment Center GE Only | 90.64% | 246 |
| PortMiami | 91.39% | 1322 |
| Sweetgrass Global Entry Enrollment Center | 95.10% | 162 |
| Pembina Global Entry Enrollment Center | 95.47% | 241 |
| Gulfport-Biloxi Global Entry Enrollment Center | 96.54% | 605 |
| Albany GE Event Enrollment | 96.90% | 18 |
| Houlton POE/Woodstock | 97.20% | 440 |
| Newark Liberty Intl Airport | 97.34% | 4357 |
| Blaine Global Entry Enrollment Center | 97.48% | 520 |
| Lansdowne (Thousand Islands Bridge) - GE ONLY | 97.54% | 106 |
| Ogdensburg Enrollment Center | 98.01% | 486 |
| Warroad Enrollment Center | 98.08% | 896 |
| Grand Portage | 98.29% | 2310 |
| Miami International Airport | 98.59% | 2690 |
| Brownsville Enrollment Center | 99.02% | 589 |
| JFK International Global Entry EC | 99.09% | 3695 |
| International Falls Global Entry Enrollment Center | 99.09% | 181 |
| Fairbanks Enrollment Center | 99.47% | 1080 |
| Calais Enrollment Center | 99.49% | 1024 |
| Nogales, AZ | 99.52% | 847 |
| Albuquerque Enrollment Center | 99.55% | 826 |
| Guam International Airport | 99.59% | 1285 |
| Champlain NEXUS and FAST | 99.59% | 798 |
| Detroit Metro Airport | 99.61% | 879 |
| San Juan Global Entry Enrollment Center | 99.64% | 3072 |
| Anchorage Enrollment Center | 99.64% | 654 |
| Detroit Enrollment Center Global Entry | 99.65% | 1409 |
| Hidalgo Enrollment Center | 99.65% | 766 |
| Douglas Enrollment Center | 99.66% | 1057 |
| Sault Ste Marie Enrollment Center | 99.67% | 510 |
| El Paso Enrollment Center | 99.68% | 996 |
| Laredo Enrollment Center | 99.70% | 1480 |
| Memphis Intl Airport Global Enrollment Center | 99.72% | 1176 |
| Derby Line Enrollment Center | 99.73% | 706 |
| Del Rio Enrollment Center | 99.73% | 417 |
| Eagle Pass | 99.80% | 609 |
| ERIE-Tom Ridge Field 2024 | 100.00% | 24 |
The table below shows the probability of an appointment being available within 90 days since March 1, 2024.
| Location | Average Probability | Number of Updates |
|---|---|---|
| SEAFO - Missoula International Airport | 0.00% | 0 |
| Richmond, VA Enrollment Center | 0.37% | 64 |
| Omaha, NE Enrollment Center | 2.17% | 143 |
| Charlotte-Douglas International Airport | 2.89% | 477 |
| San Diego International Airport EC | 4.32% | 670 |
| Milwaukee Enrollment Center | 5.22% | 510 |
| Salt Lake City International Airport | 5.53% | 2004 |
| Portland, OR Enrollment Center | 5.64% | 916 |
| Nashville Enrollment Center | 6.50% | 852 |
| Chicago Mobile Event | 6.96% | 144 |
| Otay Mesa Enrollment Center | 7.64% | 5468 |
| Atlantic City Airport Global Entry Mobile Event | 7.98% | 77 |
| Des Moines GE Enrollment Center | 8.15% | 305 |
| Huntsville Global Entry Enrollment Center | 12.06% | 1524 |
| St. Louis Enrollment Center | 12.56% | 674 |
| South Bend Enrollment Center | 12.63% | 261 |
| Bradley International Airport Enrollment Center | 13.27% | 1723 |
| Springfield - Branson National Airport, MO | 13.78% | 350 |
| Austin-Bergstrom International Airport | 13.97% | 584 |
| CFO - Louisville Intl Airport 2024 | 14.64% | 151 |
| Boise Enrollment Center | 14.71% | 404 |
| Peoria international airport | 15.78% | 216 |
| Dayton Enrollment Center | 15.80% | 1377 |
| Rockford-Chicago International Airport | 19.27% | 292 |
| Cleveland U.S. Customs and border protection | 19.92% | 1190 |
| Moline-Quad Cities International Airport | 20.88% | 282 |
| Tri-cities Enrollment Center | 21.11% | 203 |
| Kansas City Enrollment Center | 21.76% | 858 |
| San Francisco Global Entry Enrollment Center | 26.38% | 4952 |
| Cincinnati Enrollment Center | 31.25% | 1464 |
| SEAFO - Bozeman Airport | 31.55% | 127 |
| Calexico Enrollment Center | 33.00% | 1630 |
| Atlanta International Global Entry EC | 35.12% | 2170 |
| Houston Intercontinental Global Entry EC | 42.44% | 1303 |
| Denver International Airport | 42.62% | 2061 |
| BAL-FO Harrisburg Enrollment Center | 43.07% | 516 |
| BAL-FO Wilmington Delaware Enrollment Center | 43.43% | 790 |
| Blue Grass Airport 2024 | 43.61% | 102 |
| Port Clinton, Ohio Enrollment Center | 51.03% | 880 |
| Ontario Intl Airport GE (California) | 51.81% | 1498 |
| Washington Dulles International Global Entry EC | 52.52% | 2170 |
| San Antonio International Airport | 57.63% | 1884 |
| Boston-Logan Global Entry Enrollment Center | 58.06% | 2630 |
| Las Vegas Enrollment Center | 59.14% | 1649 |
| Dallas-Fort Worth International Airport Global Entry | 61.28% | 2851 |
| Norfolk EC | 61.87% | 1482 |
| Orlando International Airport | 63.08% | 2589 |
| New Jersey Metro Area Mobile EC | 63.11% | 106 |
| Seatac International Airport Global Entry EC | 63.37% | 2481 |
| Philadelphia International Airport | 64.35% | 2490 |
| Shreveport Regional Airport | 64.77% | 88 |
| Minneapolis - St. Paul Global Entry EC | 64.93% | 1655 |
| Baltimore Washington Thurgood Marshall Airport | 65.02% | 2597 |
| Chicago O'Hare International Global Entry EC | 67.41% | 3125 |
| Washington, DC Enrollment Center | 70.44% | 2159 |
| Los Angeles International Global Entry EC | 71.57% | 3687 |
| Chicago Field Office Enrollment Center | 71.59% | 2418 |
| Fargo Satellite Enrollment Center | 72.01% | 264 |
| San Luis Enrollment Center | 76.09% | 1633 |
| Tampa Enrollment Center | 76.66% | 2777 |
| Champlain Global Entry | 85.66% | 254 |
| Sweetgrass NEXUS and FAST Enrollment Center | 86.55% | 550 |
| Fort Lauderdale Global Entry Enrollment Center | 89.19% | 1746 |
| Sanford Global Entry Enrollment Center | 90.30% | 2490 |
| Sweetgrass Global Entry Enrollment Center | 95.10% | 162 |
| New Orleans Enrollment Center | 95.22% | 1343 |
| U.S. Custom House - Bowling Green | 95.28% | 4177 |
| Pembina Global Entry Enrollment Center | 95.47% | 241 |
| PortMiami | 96.12% | 1322 |
| Gulfport-Biloxi Global Entry Enrollment Center | 96.54% | 605 |
| Albany GE Event Enrollment | 96.90% | 18 |
| Pittsburgh International Airport | 97.06% | 1673 |
| Houlton POE/Woodstock | 97.20% | 440 |
| Lansdowne (Thousand Islands Bridge) - GE ONLY | 97.54% | 106 |
| Warroad Enrollment Center | 98.08% | 896 |
| Grand Portage | 98.29% | 2310 |
| Phoenix Sky Harbor Global Entry Enrollment Center | 98.40% | 2959 |
| Miami International Airport | 98.59% | 2690 |
| Ogdensburg Enrollment Center | 98.88% | 486 |
| West Palm Beach Enrollment Center | 98.96% | 1613 |
| International Falls Global Entry Enrollment Center | 99.09% | 181 |
| Honolulu Enrollment Center | 99.37% | 1463 |
| Fairbanks Enrollment Center | 99.47% | 1080 |
| Tucson Enrollment Center | 99.48% | 1581 |
| Calais Enrollment Center | 99.49% | 1024 |
| Nogales, AZ | 99.52% | 847 |
| Newark Liberty Intl Airport | 99.54% | 4357 |
| Albuquerque Enrollment Center | 99.55% | 826 |
| JFK International Global Entry EC | 99.58% | 3695 |
| Guam International Airport | 99.59% | 1285 |
| Champlain NEXUS and FAST | 99.59% | 798 |
| Detroit Metro Airport | 99.61% | 879 |
| Niagara Falls Enrollment Center | 99.61% | 2096 |
| San Juan Global Entry Enrollment Center | 99.64% | 3072 |
| Anchorage Enrollment Center | 99.64% | 654 |
| Mobile Regional Airport Enrollment Center | 99.64% | 914 |
| Detroit Enrollment Center Global Entry | 99.65% | 1409 |
| Hidalgo Enrollment Center | 99.65% | 766 |
| Port Huron Enrollment Center | 99.66% | 892 |
| Douglas Enrollment Center | 99.66% | 1057 |
| Sault Ste Marie Enrollment Center | 99.67% | 510 |
| Treasure Coast International Airport | 99.67% | 641 |
| El Paso Enrollment Center | 99.68% | 996 |
| Brownsville Enrollment Center | 99.69% | 589 |
| Laredo Enrollment Center | 99.70% | 1480 |
| Memphis Intl Airport Global Enrollment Center | 99.72% | 1176 |
| Derby Line Enrollment Center | 99.73% | 706 |
| Del Rio Enrollment Center | 99.73% | 417 |
| Blaine Global Entry Enrollment Center | 99.79% | 520 |
| Eagle Pass | 99.80% | 609 |
| Niagara Falls Enrollment Center GE Only | 99.84% | 246 |
| ERIE-Tom Ridge Field 2024 | 100.00% | 24 |